COVis’s Visualization Tool
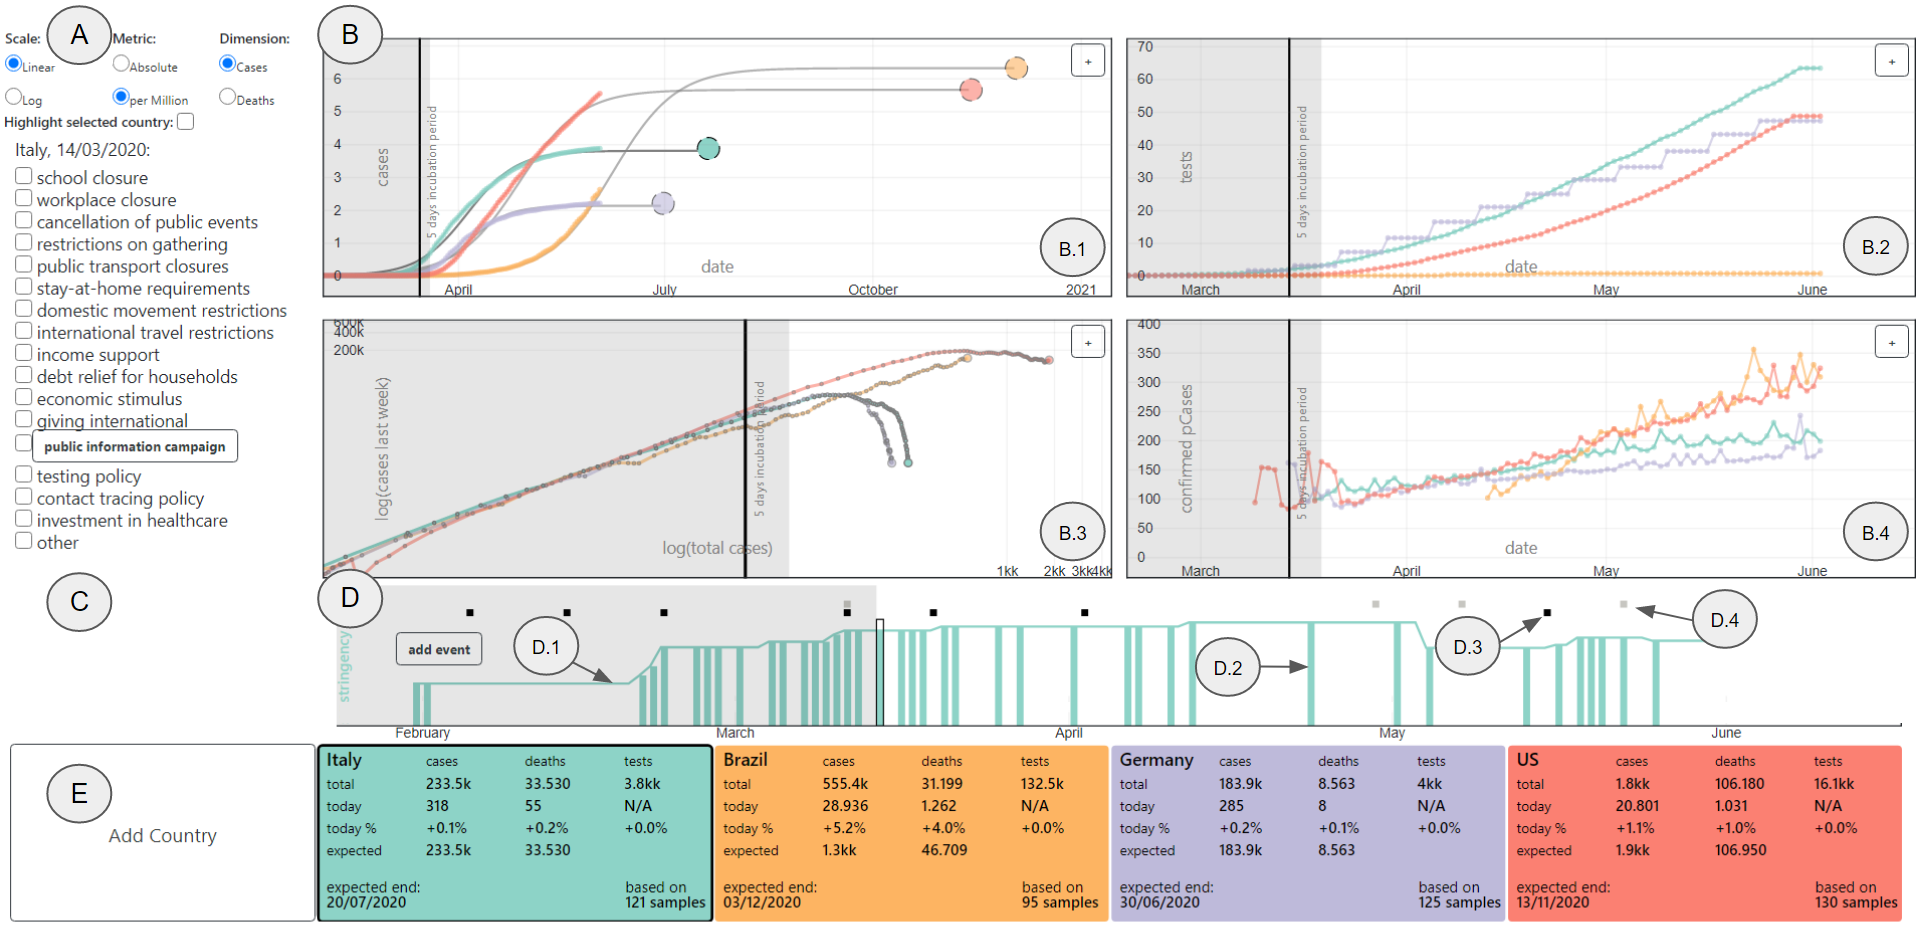
Fig. 1. COVis’s coordinated multiple view environment: (A) Control Panel: allows the user to change the graphs scale (linear / log), metric (absolute / per million cohabitants), and dimensions (cases / deaths). (B) Line charts: present four different line charts that are coordinated to support exploration of multiple narratives. Respectively, the charts display the relation between: (B1) time x cases/deaths, (B2) time x tests, (B3) total cases/deaths x last week cases/deaths, and (B4) time x cases/deaths projection length. (C) Events Panel: displays information and source references concerning main events occurred in certain time periods. (D) Events Time Chart: chart presenting the policy changes of a country over time. (E) Country Cards: show information concerning the analysed group of countries, allowing the exclusion and inclusion of different countries into the analysis.
COVIs: Supporting Temporal Visual Analysis of Covid-19 Events Usable in Data-Driven Journalisms
Roger A. Leite
roger.leite@tuwien.ac.at
Victor Schetinger
victor.schetinger@tuwien.ac.at
Davide Ceneda
davide.ceneda@tuwien.ac.at
Bernardo Henz
bernardo.henz@iffarroupilha.edu.br
Silvia Miksch
silvia.miksch@tuwien.ac.at


Abstract

Caused by a newly discovered coronavirus, COVID-19 is an infectious disease easily transmitted between people through close contacts that had exponential global growth in 2020 and became, in a very short time, a major health, and economic global issue. Real-world data concerning the spread of the disease was quickly made available by different global institutions and resulted in many works involving data visualizations and prediction models. In this paper, (1) we discuss the problem, data aspects, and challenges of COVID-19 data analysis; (2) We propose a Visual Analytics approach (called COVis) combining different temporal aspects of COVID-19 data with the output of a predictive model. This combination supports the estimation of the spread of the disease in different scenarios and allows correlating and monitoring the virus development in relation to different government response events; (3) We evaluate the approach with two domain experts to support the understanding of how our system can facilitate journalistic investigation tasks and (4) we discuss future works and a possible generalization of our solution.

Keywords

Visual Analytics; Data Visualization; COVID.

Downloads

Paper


Pre-print Version

This is the author's version of the work, and it is not for redistribution.

Check our Visualization Tool


Reference

Citation

Leite, Roger A and Schetinger, Victor and Ceneda, Davide and Henz, Bernardo and Miksch, Silvia. COVIs: Supporting Temporal Visual Analysis of Covid-19 Events Usable in Data-Driven Journalism, IEEE Visualization Conference - Short Papers, 2020.

BibTeX

@article{leite_covis:2020,
    title={COVIs: Supporting Temporal Visual Analysis of Covid-19 Events Usable in Data-Driven Journalism},
    author={Leite, Roger A and Schetinger, Victor and Ceneda, Davide and Henz, Bernardo and Miksch, Silvia},
    journal = {IEEE Visualization Conference - Short Papers},
    year = {2020},
  }
  

Acknowledgments

This work was supported and funded by the Austrian Science Fund (FWF) with the grant #P31419-N31 (KnoVA).